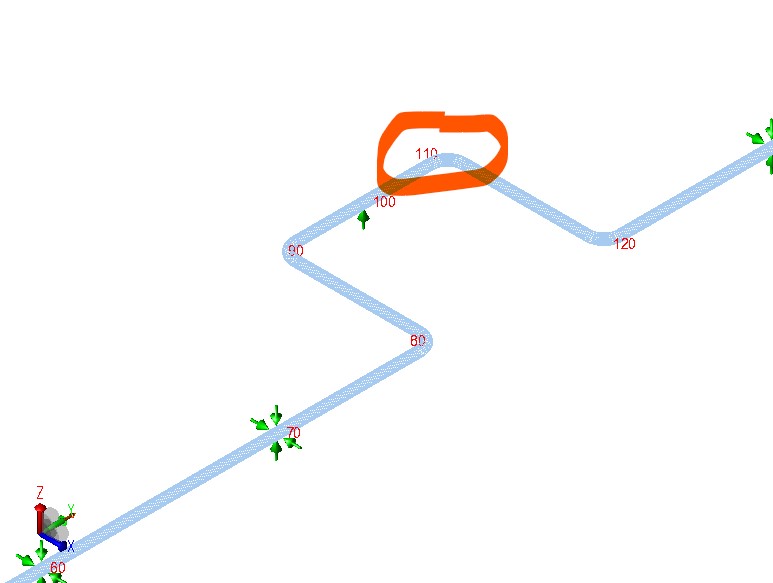
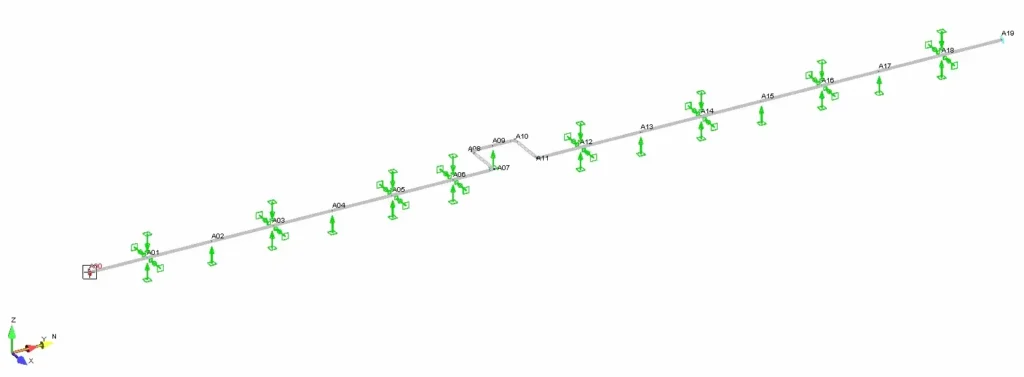
In this post, I'll compare the results from two programs for an identical model. This is a pipeline section on a viaduct with a deliberate lack of symmetry at the supports. I wanted it to be a mirror image of the center of the U-shape. The pipeline data: 4′, STD, A106-B, CA=0mm. The AutoPipe model looks like this:
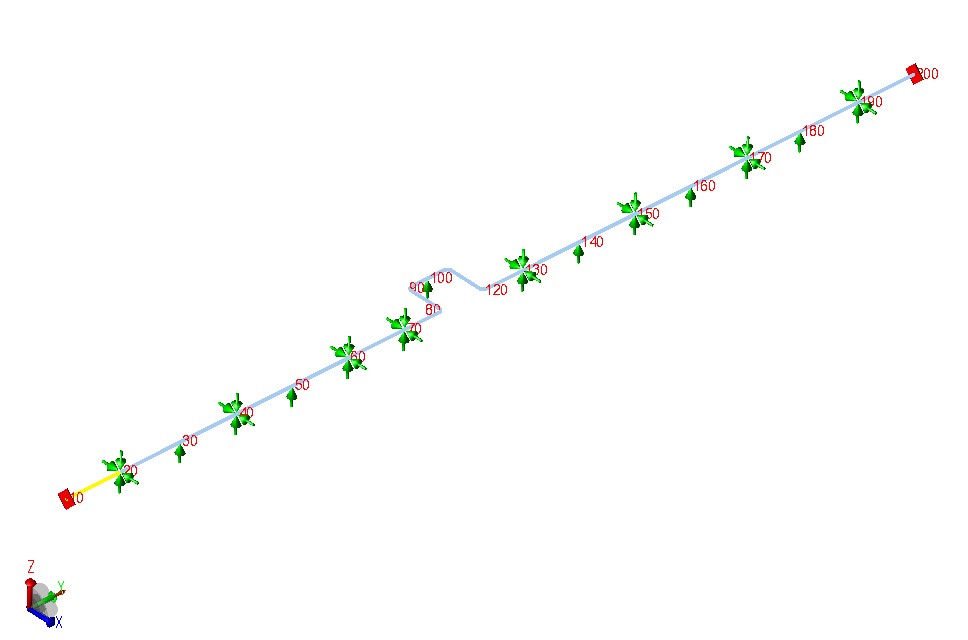
In Caesar II the model looks like this:
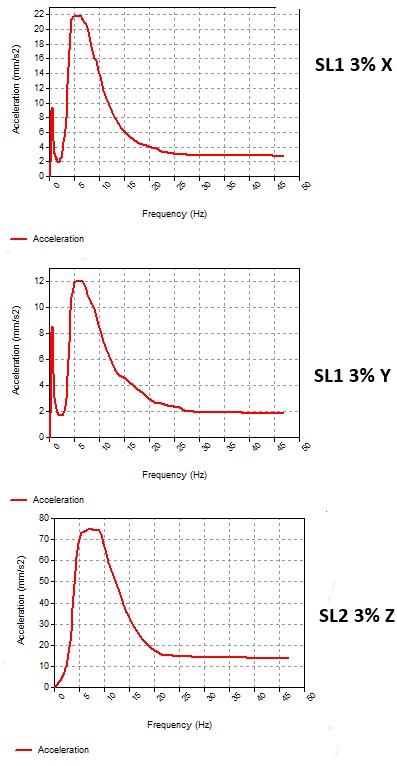
Both models, of course, received identical seismic excitations. The accelerations in each direction are slightly different. They act on the ENTIRE model simultaneously. The acceleration unit is mm/s², meaning 80 mm/s² is just 0.08 m/s², which is very low. There are no defined seismic displacements. For simplicity, wind and snow were omitted. Therefore, the only occasional load is seismic.
The results for the static analysis in AutoPipe are typical and not cause for concern. The stress on the arc ranges from 29 to 45%.
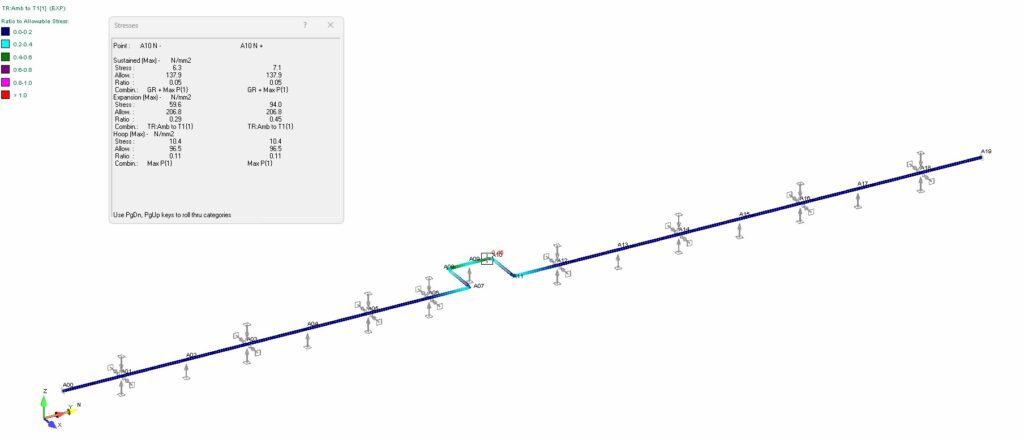
After adding the dynamic analysis, the result appears with the designation R1. This is the Response Spectra result No. 1. The effort is only 3 to 4% for SUS+R1.
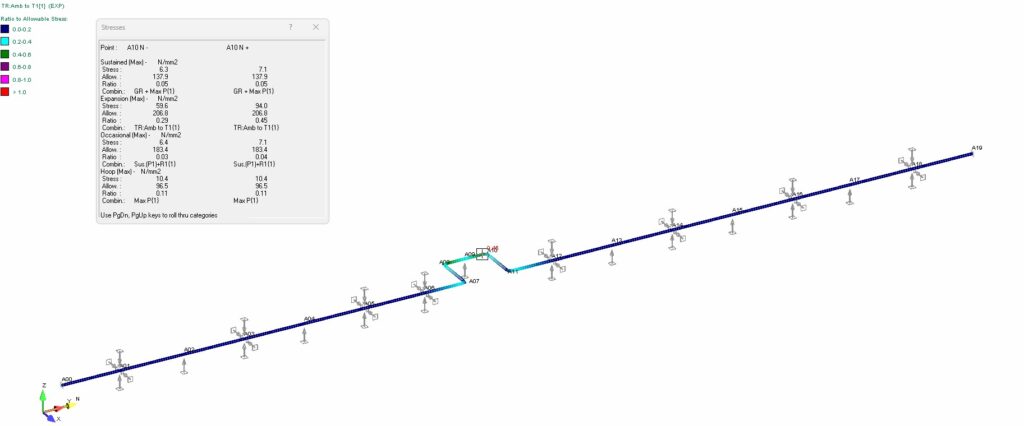
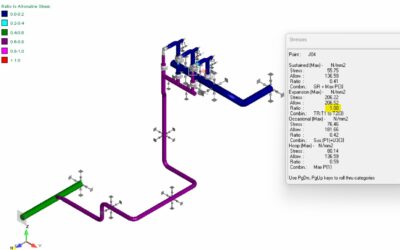
Static results on Caesar II are similar. The strain for the same load combination is 33%.
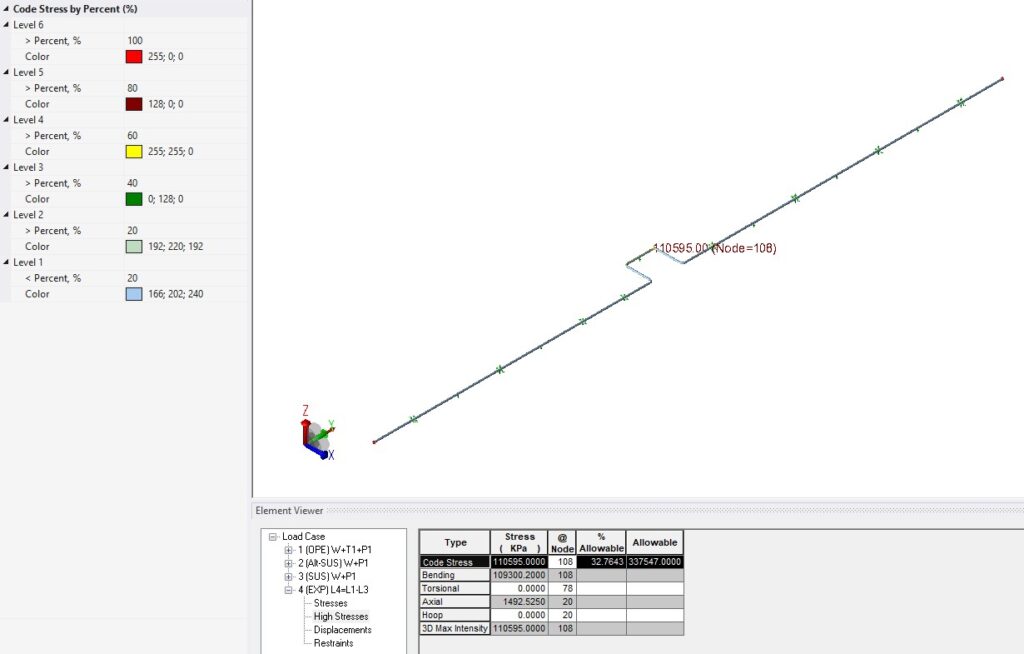
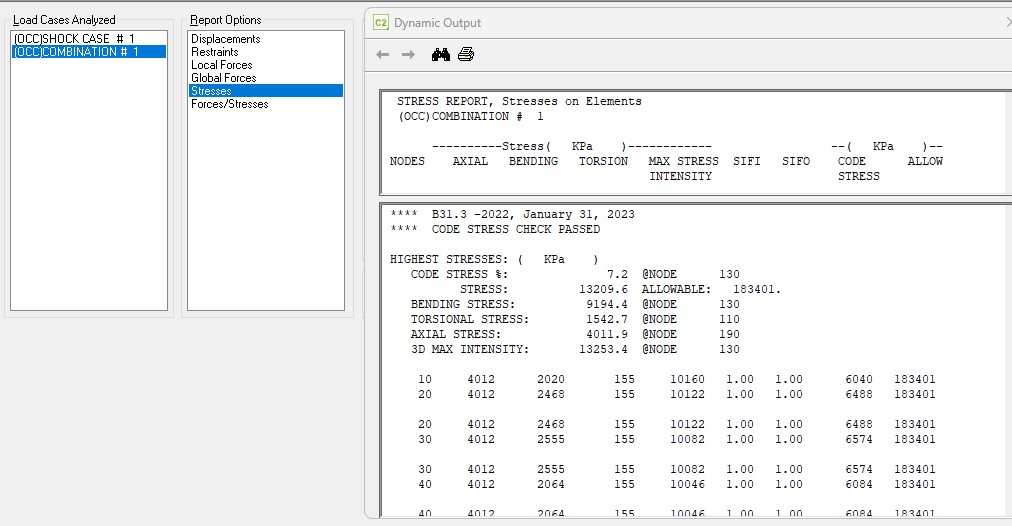
Unfortunately, Caesar II's dynamic analysis results leave much to be desired. First, they're not presented graphically, only numerically. Therefore, we have to exit the dynamics section and open the Input section to see where the node is at its peak intensity. THIS IS TERRIBLE SOLUSION..